I thought for this week’s post, it would be a good time to provide an update on the housing market. My last update was at the end of July:
Some of the data is only available for July, but there is some real time (weekly) data published by Redfin that is interesting and of course there is also the FRED database charts that are fairly up to date. With that, let’s dive in.
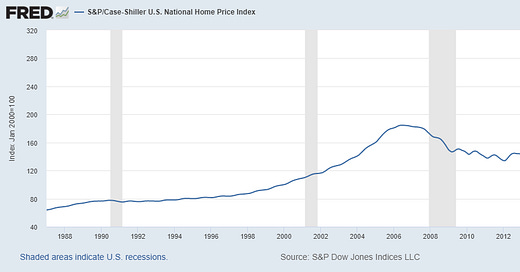
First chart is S&P / Case-Schiller US National Home price index. If you look at the long term trend, we are well above the peak in the year preceding the Great Financial Crisis. This is, of course, a big cause for concern among housing market watchers who have been calling this a “massive bubble.” Seems reasonable.
If you zoom in to the one year view, the price action while still quite a bit higher over the past year, seems to be flattening out recently, a sign the market pricing is adjusting to the new reality of higher interest rates, thanks to the Federal Reserve:
Interestingly, housing affordability seemed to have bottomed in June and has been improving, possibly due to recently softer prices:
Meanwhile, the 30-year fixed rate mortgage has been bouncing up and down in a range between 5% and 6%, a significant amount of volatility, but still quite low by historical standards:
The delinquency rate on single family residential mortgages continues to be very low:
The National Association of Realtors reported in July that existing home sales were down 5.9% month over month and down 20.2% year over year, with inventory growing and prices 10.8% higher than last year:
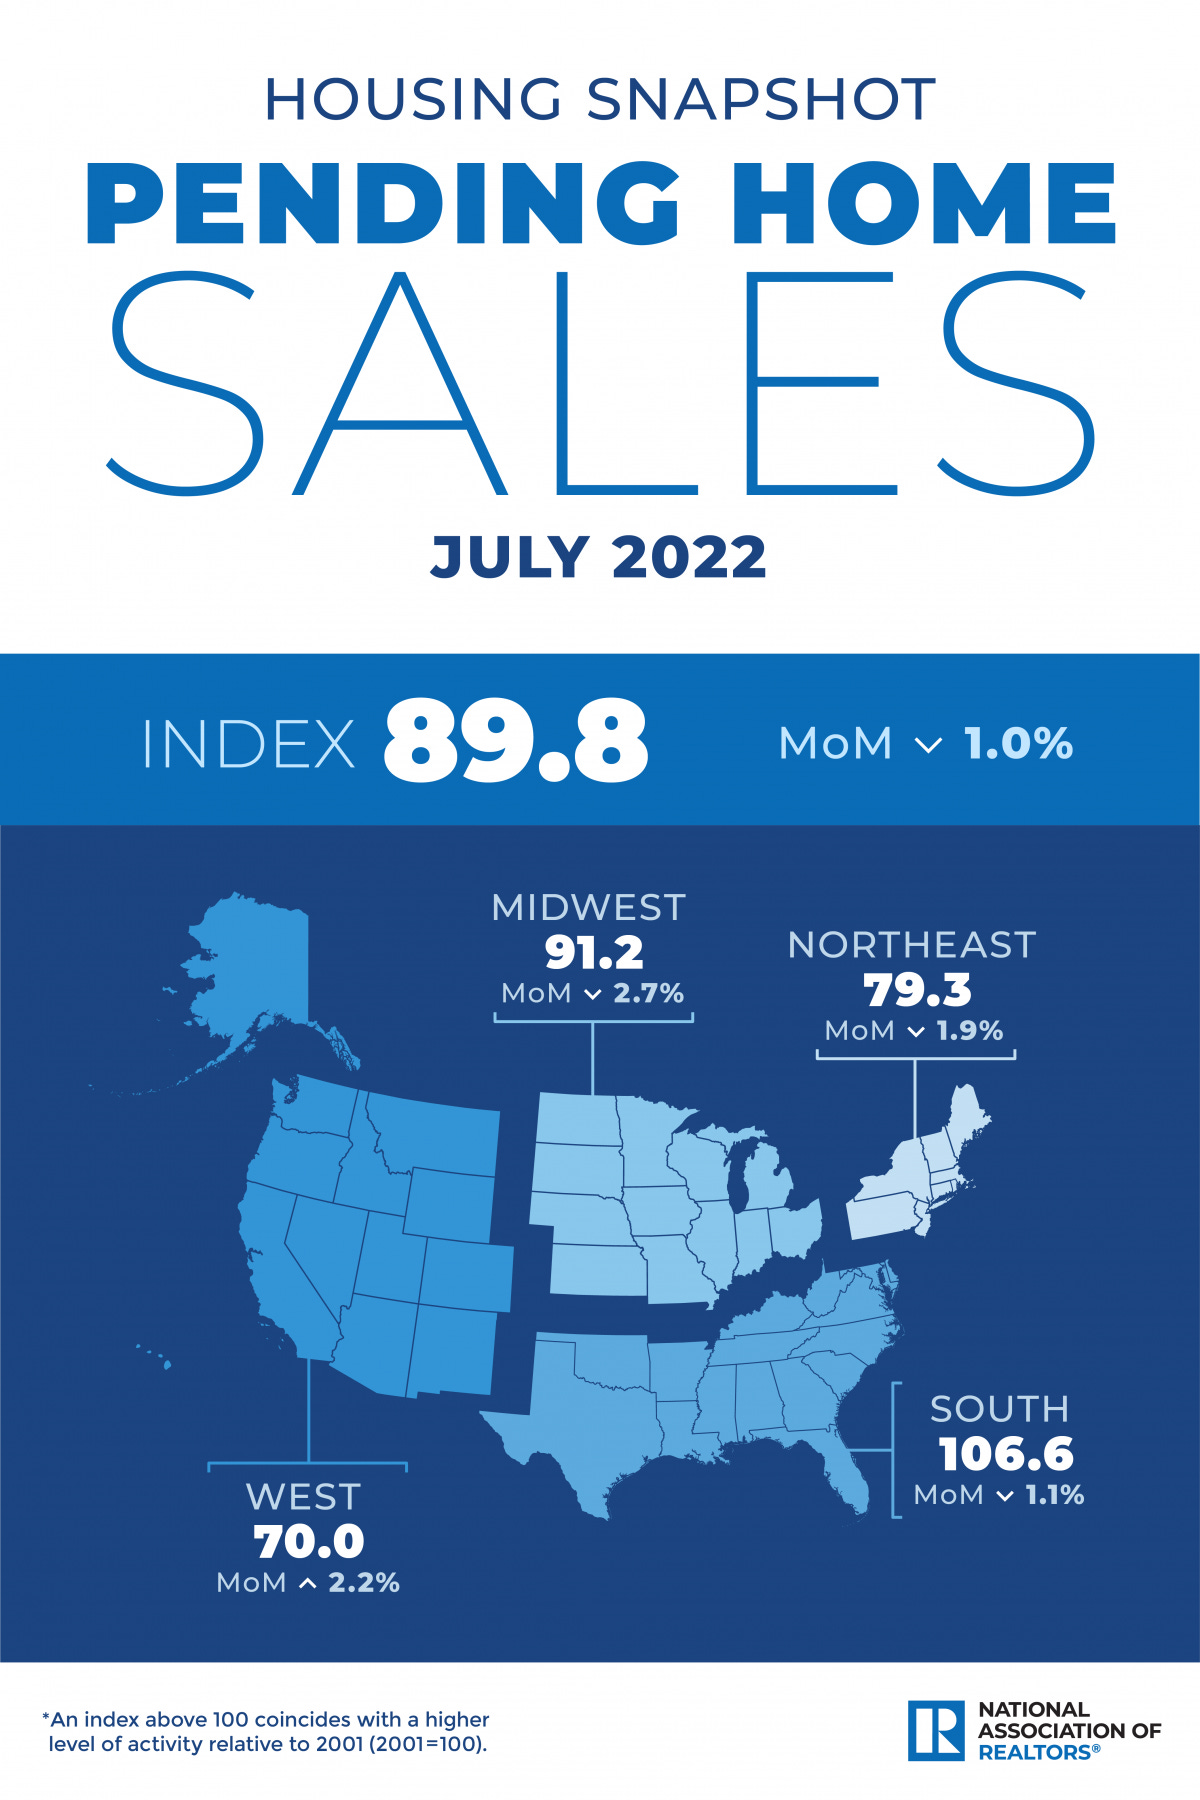
The National Association of Realtors also reported pretty much the same picture for pending home sales in July, with those down 1% month over month; the picture is quite different by region with the west showing an uptick (from a comparatively low level of activity) while the other regions were down, but with comparatively higher levels of activity:
Finally, the National Association of Realtors also does a Realtors Confidence Index which I thought was interesting. Here’s the latest as of July:
The REALTORS® Confidence Index (RCI) survey gathers on-the-ground information from REALTORS® based on their real estate transactions in the month. This report presents key results about market transactions.
Highlights
82% of respondents reported properties sold in less than one month. Down from 88% a month ago and down from 89% in July 2021.
Homes listed received an average of 2.8 offers, down from 3.4 offers in June 2022 and 4.5 in July 2021.
First-time buyers represented 29% of buyers, virtually unchanged from one year ago and one month ago
24% of buyers were all-cash sales, similar to last month at 25% and up from 23% in July 2021.
Redfin has some great weekly data located here. Below are a few of the more interesting charts.
Here’s the new listings through September 4. For 2022 (black line), they are showing a definite downtrend below the prior three years with new listings down 17.5% year over year, which means supply of homes for sale is declining:
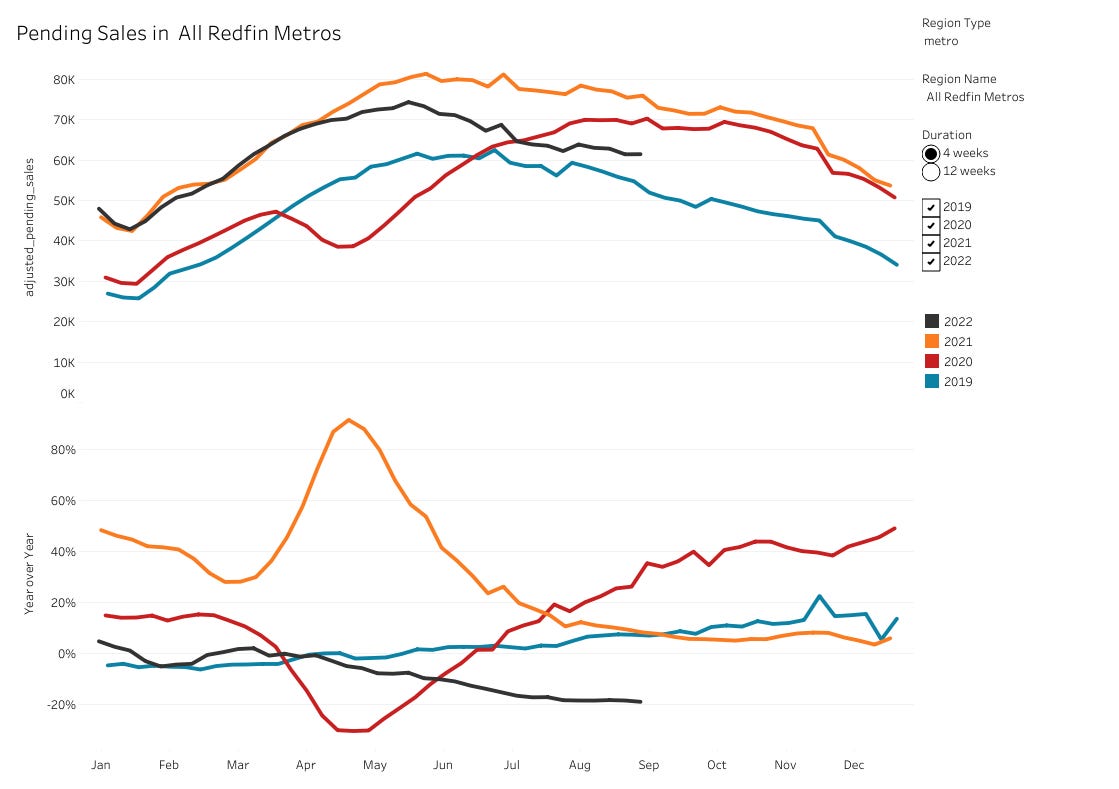
Here’s the pending sales through September 4. For 2022 (black line), they are showing pending sales trending below 2020 and 2021 but above 2019. While pending sales for 2022 are down 19% year over year, the trend appears to be flattening out.
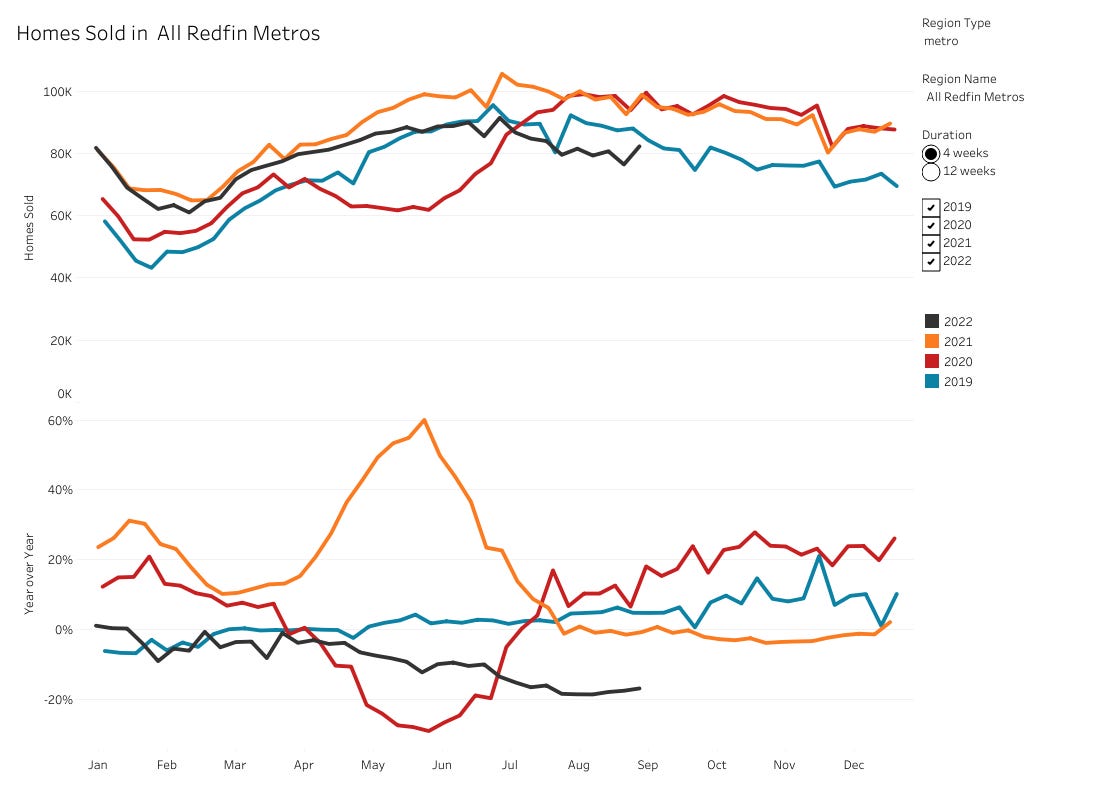
Here’s homes sold through September 4. For 2022 (black line), they are showing sales trending below the prior three years (including 2019), but sales look to have ticked up recently while still down 16.8% year over year.
The final chart and the most interesting one is price drops, which have increased substantially this year, are at levels much higher than each of the prior three years and seem to have leveled off recently. A little over 7% of all listings have had price drops this year:
Redfin’s data on rent vs own is a bit dated (last data update was June). At that time, it was still cheaper to own than to rent on average. Of course, that can vary by city and region. For example, coastal markets are much more expensive to own in and so there tends to be more renters in those markets. My thought is that if prices decline as they appear to be recently, as long as mortgage rates stabilize at these levels while rents continue to increase, the “gap” in the chart should narrow further which could increase the attractiveness of home ownership versus renting.
In summary, the housing market is definitely slowing down by all accounts, but still seems to be resilient. Sellers are pulling homes off the market if they don’t need to sell and those that do need to sell are making appropriate price adjustments to bring in buyers, which is helping affordability. The wild card is interest rates and what the Federal Reserve will do in the coming weeks and months to reign in inflation. Ironically, if the Fed tips the economy into a recession by raising short-term interest rates too high, that would normally result in lower long-term interest rates (since the Fed would have to “pivot” and lower interest rates to support the economy). This would be supportive of real estate, except for the headwind caused by rising unemployment in a recession; hard to buy a home without a job. What’s a little less certain is whether we will continue to see persistently high inflation and what effect that will have on longer term interest rates, which are critical for housing.
While investment property is still a bit pricey and hard to make the numbers work at these levels (goal being positive monthly cash flow), it might not be a bad time to buy a home as long as you can afford the payment and are willing to stay put for a few years. A 30-year fixed rate mortgage is an asset in an inflationary environment becaue as a borrower you are paying your loan back in depreciating dollars over time. The underlying value of the real property should hold up over time, even if you have to wait out a cyclical downturn. When I bought my current home in 2006, I pretty much knew it was the peak of the market and when the market crashed, it took about 9 years for the value to recover. Fortunately, I could afford the payment, my family enjoyed the home / neighborhood and I knew I was going to be there for the long haul. Buying a home in my mind is less of an investment and more about what your family needs than anything else, but other than owning Bitcoin I don’t know any better way to protect / build wealth than through owning real estate.
Not financial or legal advice, for entertainment only, do your own homework. I hope you find this post useful as you chart your personal financial course and Build a Financial Fortress in 2022. To see all my books on investing and leadership, click here.
Always remember: freedom, health and positivity!
Please also check out my Building a Financial Fortress Podcast on YouTube here and on all your favorite streaming platforms.


