I thought for this week’s post, it would be a good time to provide an update on the housing market. My last update was in September:
Some of the data is only available for August, but there is some real time (weekly) data published by Redfin that is interesting and of course there is also the FRED database charts that are fairly up to date. With that, let’s dive in.
First chart is S&P / Case-Schiller US National Home price index (not seasonally adjusted). If you look at the long term trend, we are well above the peak in the year preceding the Great Financial Crisis. This is, of course, a big cause for concern among housing market watchers who have been calling this a “massive bubble.” Seems reasonable. It’s hard to see, but the index is starting to drop after peaking back in June.
If you zoom in to the one year view, the price action while still quite a bit higher over the past year, is clearly declining recently, a sign the market pricing is adjusting to the new reality of higher interest rates, thanks to the Federal Reserve:
Here’s a chart of the 30 year fixed rate mortgage rate, which has basically gone vertical since bottoming last summer, approaching levels not seen in 20 years and is probably the main driver for slowdown in sales and declining prices - this would tend to make people reluctant to move (and refinance) who are in sub-3% mortgages. Higher payments driven by higher rates, without any meaningful price adjustments, are unattractive to new homebuyers:
Interestingly, housing affordability while at extremely low levels seemed to have bottomed in June and has been improving, possibly due to recently softer prices, which is a good sign for new homebuyers:
The delinquency rate on single family residential mortgages continues to be very low and declining, which is a positive sign:
The National Association of Realtors reported in September that existing home sales were down 1.5% month over month and down 23.8% year over year, with inventory growing and prices 8.4% higher than last year:
The National Association of Realtors also reported a bit darker picture for pending home sales in September, with those down 10.2% month over month; the results are not uniform by region, with the northeast showing the worst decline at 16.2%, followed by the west at 11.7% and the mid west and south in the 8%-9% range:
Finally, the National Association of Realtors also does a Realtors Confidence Index which I thought was interesting. Here’s the latest as of September:
The REALTORS® Confidence Index (RCI) survey gathers on-the-ground information from REALTORS® based on their real estate transactions in the month. This report presents key results about market transactions.
Highlights
First-time buyers represented 29% of buyers, virtually unchanged from one year ago and one month ago.
22% of buyers were all-cash sales, down slightly from 24% last month and 23% in September 2021.
70% of respondents reported properties sold in less than one month. Down from 81% a month ago and down from 86% in September 2021.
90% of buyers purchased in a suburb, small town, rural, or resort area, up slightly from last month and one year ago.
Redfin has some great weekly data located here. Below are a few of the more interesting charts.
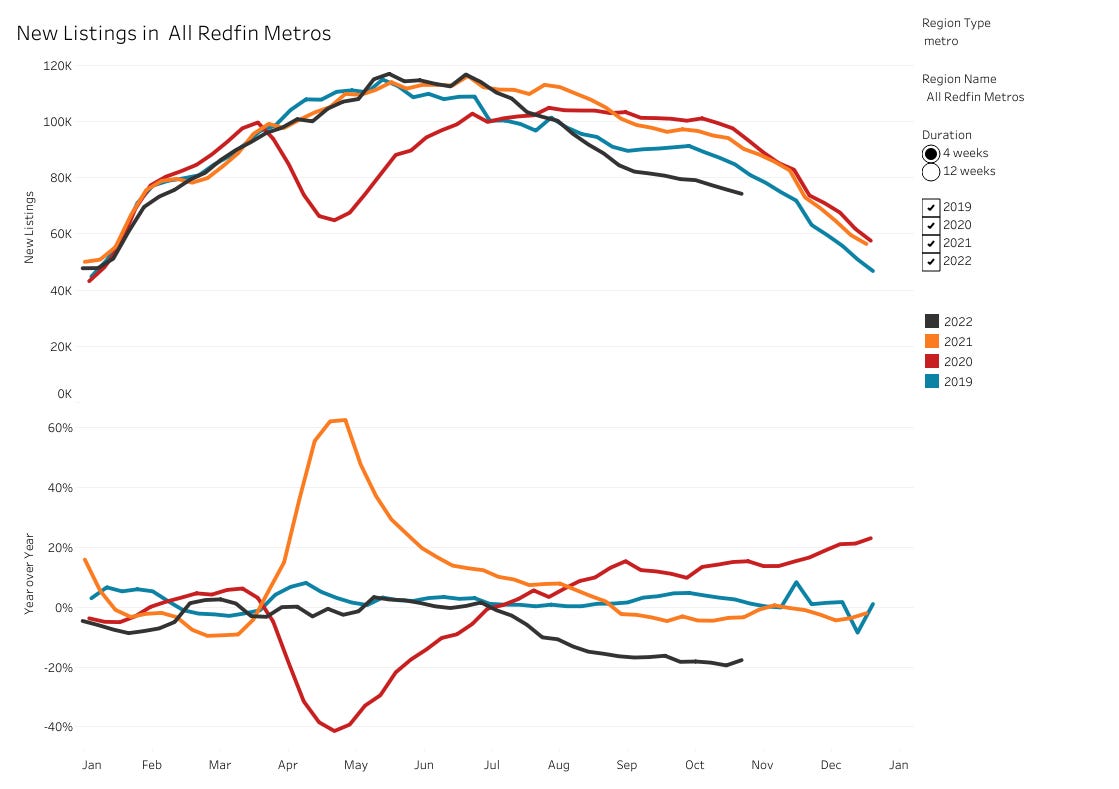
Here’s the new listings through October 30. For 2022 (black line), they are showing a definite downtrend below the prior three years, with new listings down 17.7% year over year. It’s hard to see, but note that the rate of change ticked up recently in the bottom chart, which means that while the supply of homes continues to decline, that may be moderating:
Here’s the pending sales through October 30. For 2022 (black line), they are showing pending sales trending below all three prior years. Pending sales for 2022 are down a whopping 35.8% year over year and the trend is continuing to worsen, which is troubling:
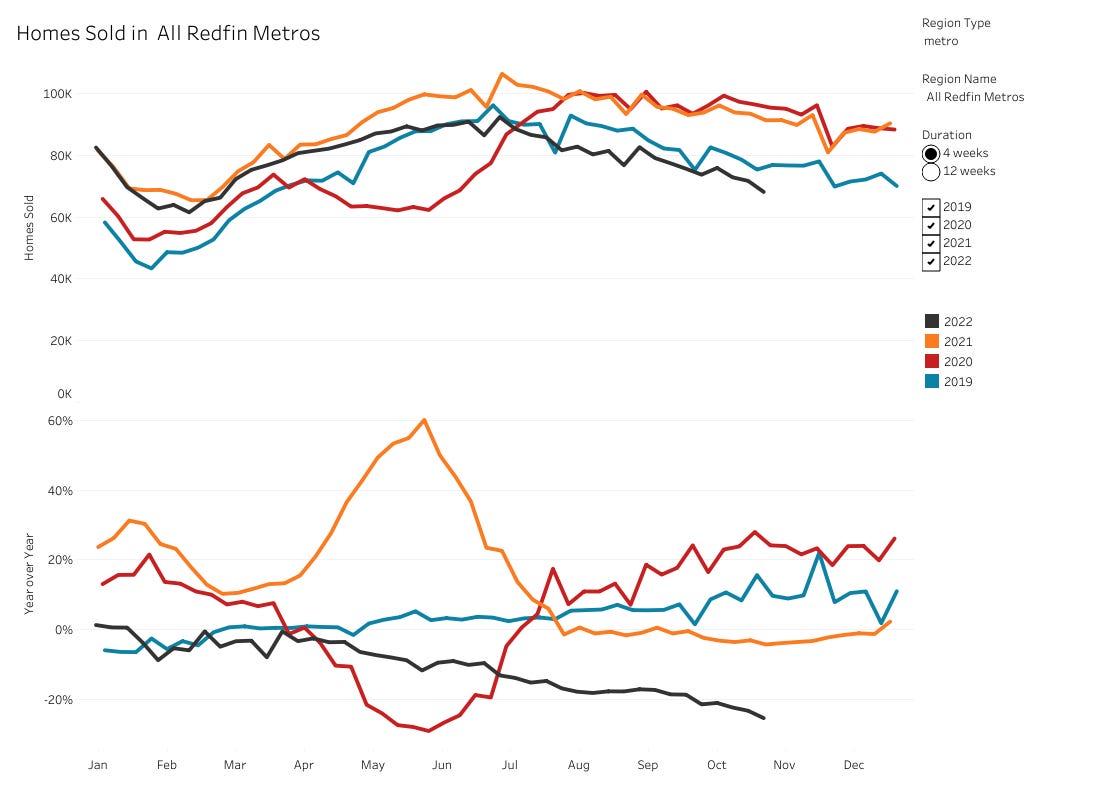
Here’s homes sold through October 30. For 2022 (black line), they are showing sales trending below the prior three years, down 25.4% year over year and continuing to show a rather strong declining trend:
The final chart and the most interesting one is price drops, which have increased substantially this year, are at levels much higher than each of the prior three years and continue to grow. Almost 8% of all listings have had price drops this year:
Redfin’s data on rent vs own is a bit dated (last data update was June). At that time, it was still cheaper to own than to rent on average, although the gap had narrowed considerably. Of course, that can vary by city and region. For example, coastal markets are much more expensive to own in and so there tends to be more renters in those markets due to the higher down payment required to buy. My thought is that if prices continue to decline as they appear to be recently, as long as mortgage rates stabilize at these levels while rents continue to increase, the “gap” in the chart should widen to more historic levels, which could increase the attractiveness of home ownership versus renting.
In summary, the housing market continues to slow, and while not collapsing, government policy seems more about controlled demolition through higher interest rates. Sellers are pulling homes off the market if they don’t need to sell and those that do need to sell are making price adjustments to bring in buyers, which is helping affordability. The wild card is interest rates and what the Federal Reserve will do in the coming months to reign in inflation - the message from this last week’s Fed meeting was clear that they will raise rates higher and leave them there for longer, which does not bode well for the housing market (or the stock market, bond market, etc.). Prices are set at the margin and the marginal seller is what is going to drag down the overall market. As time goes on, especially in a recession, there will be more and more marginal sellers. This will also include investors, as noted below.
Ironically, if the Fed tips the economy into a recession by raising short-term interest rates too high / too fast, that would normally result in lower long-term interest rates (since demand collapses and the Fed would have to “pivot” and lower interest rates to support the economy). Indeed, this is what the inverted yield curves are showing us now (higher interest rates on short term government debt and lower rates on longer term government debt).
This would be supportive of housing, except for the headwind caused by rising unemployment in a recession; hard to buy a home without a job. What’s a little less certain is whether we will continue to see persistently high inflation and what effect that will have on longer term interest rates, which are critical for housing. While this doesn’t seem like the Great Financial Crisis level of housing risk, there are some interesting things to consider including investor demand for houses, which has been enormous over the past few years, as noted in a recent Pew research study. This can quickly turn around when the fundamentals change:
Investors bought nearly a quarter of U.S. single-family homes that sold last year, often driving up rents for suburban families in the process.
The issue is especially acute in some Sun Belt states amid evidence that investors often can outbid other buyers, keeping starter homes out of the hands of would-be owners, especially suburban Black and Hispanic families. Some local officials in those states are pushing for increased regulation of investor purchases, but many Republican lawmakers oppose such controls.
Investors bought 24% of all single-family houses sold nationwide last year, up from 15% to 16% annually going back to 2012, according to a Stateline analysis of data provided by CoreLogic, a California-based data analytics firm. That share dipped only slightly in the first five months of 2022 to 22%.
Investor purchases doubled or more in Florida, Nevada, Vermont and Washington state from 2020 to 2021. In Vermont, they grew from 7% of sales in 2020 to 17% last year and in Nevada from 18% to 30%.
Five states saw the highest share of investor purchases. Investors bought a third of single-family homes sold in Georgia (33%) last year, with Arizona (31%), Nevada (30%), California and Texas (both 29%) not far behind.
Investor ownership began to grow after the Great Recession of 2008-2009, when large swaths of overbuilt Sun Belt homes went into foreclosure, and investors snapped them up. Investor ownership grew again last year as pandemic-related demand for suburban housing rose, and investors saw a chance to win bidding wars with cash offers.
Speaking to fundamentals, if you can get 4.6% on a six month “risk free” Treasury bill, why wouldn’t you take that versus holding a rental property that yields 4% or less and you have to deal with tenants, taxes and toilets? Seems like a no-brainer for an investor and we’ll see what the “smart money” does in the coming months and into 2023. The crowd who bought homes at peak prices over the past year to convert them to AirBNB may soon face a difficult situation in a recession when travel typically slows down and this could add to selling pressure along with institutional sellers next year.
While owning a home and investment property has richly rewarded those who have bought at the right price and held for a long time, I’m growing increasingly concerned that the “monetary premium” that has attached itself to real estate due to unstable fiat currency will be eroded away to other, better stores of value like Bitcoin or precious metals, which is why I have a significant allocation to both in my portfolio and have been actively reducing real estate. If you missed last week’s portfolio update here’s a link below:
There is fundamental value to real estate that will grow over time due to its utility and scarcity of developable land, but the massive money printing that has gone on globally for decades and which went into high gear in 2020 has distorted all price signals. The “everything bubble” seems to be slowly bursting and assets like real estate, stocks, bonds, etc. that carried a monetary premium seem destined to reset to their fundamental value. This fundamental value needs to be determined by market forces without the influence of centrally planned interest rates. That’s why as an investor, I would be patiently waiting to re enter the real estate market after the bubble has burst.
Owning a home for me is more about what your family needs as shelter and less of an investment. Indeed, a 30-year fixed rate mortgage is an asset in an inflationary environment because as a borrower you are paying your loan back in depreciating dollars over time. The underlying fundamental shelter value of the real property should hold up over time, even if you have to wait out a cyclical downturn. When I bought my current home in 2006, I pretty much knew it was the peak of the market and when the market crashed, it took about 9 years for the value to recover. Fortunately, I could afford the payment, my family enjoyed the home / neighborhood and I knew I was going to be there for the long haul. Buying a home in my mind is less of an investment and more about what your family needs than anything else.
Not financial or legal advice, for entertainment only, do your own homework. I hope you find this post useful as you chart your personal financial course and Build a Financial Fortress in 2022. To see all my books on investing and leadership, click here.
Always remember: freedom, health and positivity!
Please also check out my Building a Financial Fortress Podcast on YouTube here and on all your favorite streaming platforms.


