Bitcoin Price
People get interested in Bitcoin for the number go up and stay for the revolution.
I have written a lot about why Bitcoin is a good asset to own as part of a diversified portfolio. A lot of people would agree with me (not just hardcore Bitcoiners) that Bitcoin has the following qualities:
Can be self-custodied and held outside the banking system, which is a good hedge if you don’t trust global central planners; gold bugs and Libertarians understand this concept well
Absolute scarcity, fixed supply
Can be transferred peer to peer without an intermediary
The one thing that is hard to determine with Bitcoin is the demand for it, both short and long term. Clearly, adoption globally is the main driver of demand over the long haul and in the short term, monetary policy, correlation with other markets, speculation and action by large owners of Bitcoin (whales) creates tremendous volatility in price. I haven’t talked much about price action in recent posts, since I have been more focused on the bigger reasons to own Bitcoin. However, we all got interested in Bitcoin for the number to go up, so I wanted to devote this post to a recap of historical price action, a discussion of the stock to flow model and a newer take on stock to flow from Jurrien Timmer, Director of Global Macro at Fidelity that came out last week, as well as a couple of other thoughts on price targets.
First things first, here’s the historical price chart for Bitcoin:
Here’s the same chart presented as a logarithmic function which smooths out the cyclical ups and downs of the bull and bear markets (this better helps illustrate the long term growth in value of Bitcoin):
I first got involved in Bitcoin at the peak of the last cycle in 2017, when Bitcoin peaked at around $19K in December 2017 and then plummeted to a low of about $3,400 in early 2019, a draw down of 82%. That’s enough to shake the confidence of most people, but fortunately I was buying really small amounts and dollar cost averaging, so I just kept buying and holding. More recently, the price after spiking up to the new all time high of about $65K has dropped back down into the mid-$20s to low $30’s or roughly a 50% draw-down. Despite all the turmoil in stock and bond markets, Bitcoin seems to have settled into a range that is well above the prior 2017 cyclical peak. Some have called for much lower prices yet to come (Scott Minerd of Guggenheim recently said he can see $8,000 for Bitcoin as noted in the clip below):

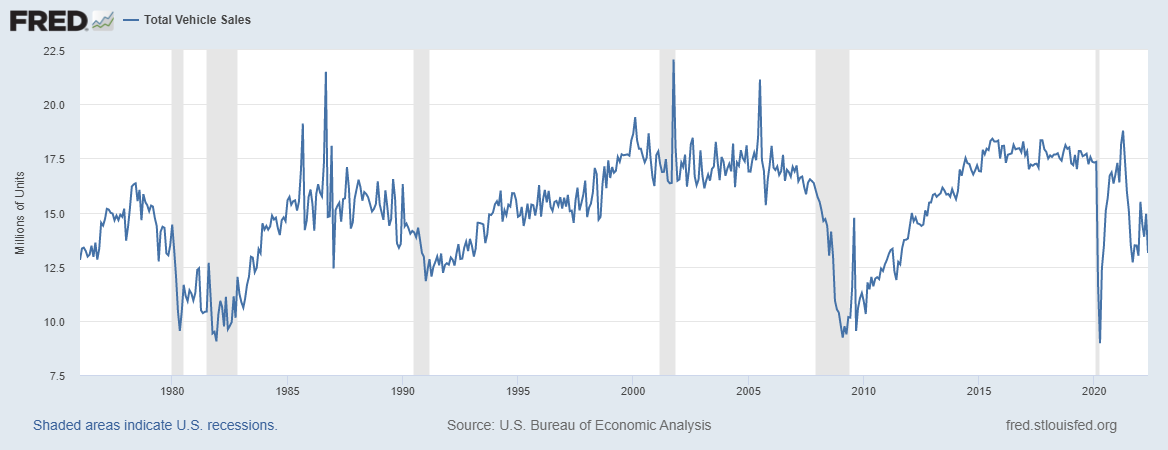
I think a Bitcoin sell-off of the magnitude referenced by Minerd would have to be driven by an even more cataclysmic sell-off in the stock market similar to a 1929 level crash event. While we can’t rule that out completely, I don’t think the Federal Reserve is going to let that happen. I could be wrong, but I think it’s only a matter of time before they go back to “easy money” policies with the massive amount of debt in the system - national debt over $30 Trillion and that doesn’t even include unfunded Social Security and Medicare liabilities. Our highly leveraged, interconnected global financial system simply can’t handle higher interest rates for very long. Indeed, we may already be in a recession and there’s nothing like a recession to lower aggregate demand and ultimately reduce inflation - last week we saw some companies announce hiring freezes (Coinbase) and layoffs (Tesla). Check out this chart showing declining demand for heavy trucks, another indication of an economic slowdown coming:
The same is true for total vehicle sales:
As such, we are likely to soon see a decrease in the rate of growth of inflation (maybe year over year inflation goes down to 5% or 6% from over 8%), which would give the Fed cover to pivot back to looser financial conditions to calm markets.
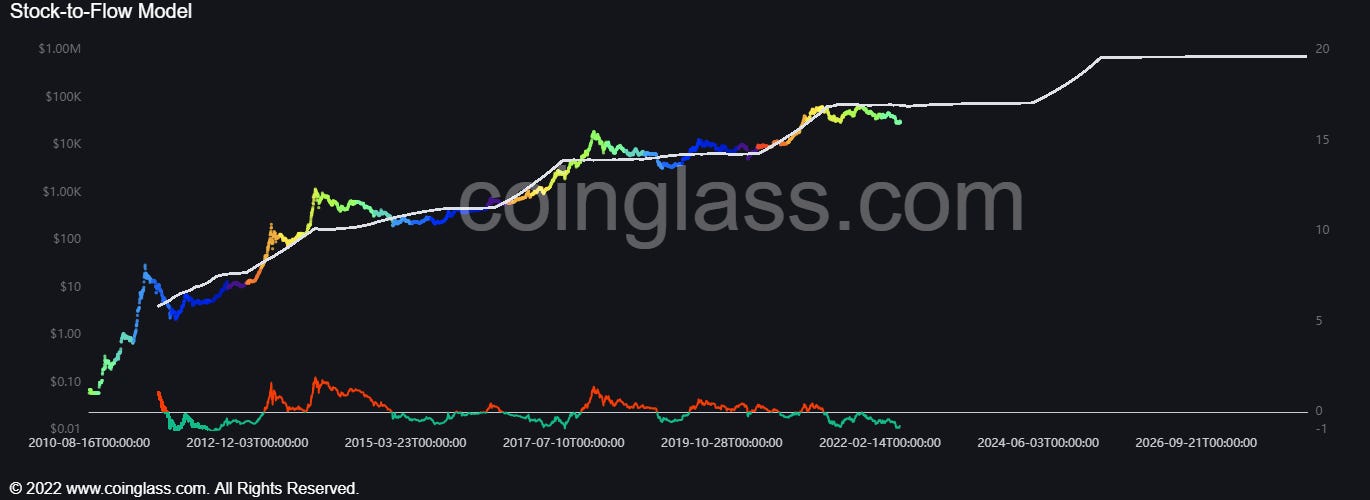
The stock to flow model is one tool that Bitcoiners have used to try to estimate the trajectory of the Bitcoin price as adoption unfolds. Basically it models the stock (Bitcoins currently in circulation) and the flow (Bitcoins to be mined in the future). Future Bitcoin issuance increases at a slower rate with each halving cycle when mining rewards are reduced by half every four years, ultimately peaking at 21 million.
Here’s an explainer from Coinglass.com:
This model treats Bitcoin as being comparable to commodities such as gold, silver or platinum. These are known as 'store of value' commodities because they retain value over long time frames due to their relative scarcity. It is difficult to significantly increase their supply i.e. the process of searching for gold and then mining it is expensive and takes time. Bitcoin is similar because it is also scarce. In fact, it is the first-ever scarce digital object to exist. There are a limited number of coins in existence and it will take a lot of electricity and computing effort to mine the 3 million outstanding coins still to be mined, therefore the supply rate is consistently low. Stock-to-flow ratios are used to evaluate the current stock of a commodity (total amount currently available) against the flow of new production (amount mined that specific year).
For store of value (SoV) commodities like gold, platinum, or silver, a high ratio indicates that they are mostly not consumed in industrial applications. Instead, the majority is stored as a monetary hedge, thus driving up the stock-to-flow ratio.
A higher ratio indicates that the commodity is increasingly scarce - and therefore more valuable as a store of value.
As you can see in the stock to flow chart above, Bitcoin has cyclical peaks (bull markets - 2013 and 2017) where it rises well above the stock to flow line and then reverts back to the line, sometimes dipping below before returning to the trendline. We are currently trending below the stock to flow line and have been since about this time last year, but that’s not surprising since everyone generally agrees Bitcoin and other cryptocurrencies (not to mention stocks and bonds) are currently in a bear market. This particular model shows Bitcoin reaching $700K per coin by mid-2025.
Just this week, Jurrien Timmer the Director of Global Macro at Fidelity, a relatively strong supporter of Bitcoin, came out with a new take on the Bitcoin supply and demand model. Here’s his tweet below:


By looking at adoption curves of similar technologies (thinking of Bitcoin as internet payment technology that is analogous to mobile phones or the internet in general), he suggests that perhaps Bitcoin’s growth curve is more “mature” than he previously thought. Based on that assumption, he suggests that the price in the next five years would be $71K if using the internet model, $307K using a modified supply model and $578K using the mobile phone model, which he deems a “more viable analog.”
There are others with more aggressive price targets, including Cathy Wood who was recently quoted in an interview on Yahoo Finance seeing a price target of $1M between 2026-2030 due to institutional investment adoption driving the relatively small market cap higher with just a small reallocation (2% to 2.5%) from other assets such as bonds, stocks and real estate. Indeed, as I mentioned last week in my podcast, JP Morgan recently announced that Bitcoin is its preferred alternative asset over real estate, which is bullish for adoption.
Another person I follow, Arthur Hayes (co founder of 100x) also has a $1M price target for Bitcoin, mostly driven by macro forces that will be unleashed when (not if) the Fed pivots back to easy money policy for the reasons I outlined above. He also sees a relatively moderate downside risk from current levels. Here’s his latest post:
Clearly, with current prices hovering around $30K, in almost any of the scenarios above, Bitcoin represents an investment that presents relatively low downside risk relative to its upside. Traders call this “asymmetric.” When you add in all the other reasons to own Bitcoin, including censorship resistance, scarcity, peer to peer transfer without an intermediary and self-custody, I actually think it’s more risky not to have some Bitcoin than it is to have some in your portfolio. People in the developing world have already learned about the benefits of Bitcoin as they have faced hyperinflation, collapsing currencies, capital controls and authoritarian governments. The western developed countries have not had to deal with these situations historically, but that might not always be the case with massive and growing national debts. As I wrote last week, we should not think it “can’t happen here.” Obviously, you need to make decisions about allocation percentage and if you can’t sleep at night you probably have too much Bitcoin in your portfolio. Check out my monthly asset allocation updates if you’re interested in how I maintain a diversified portfolio that is designed for times like these. I also recently posted about diversifying your life and assets internationally if you’re interested here.
Not financial or legal advice, for entertainment only, do your own homework. I hope you find this post useful as you chart your personal financial course and Build a Financial Fortress in 2022. To see all my books on investing and leadership, click here.
Always remember: freedom, health and positivity!
Please also check out my Building a Financial Fortress Podcast on YouTube here and on all your favorite streaming platforms.


Great article! Thanks for this.