Introduction
Over the past decade, Bitcoin’s price has shown a striking relationship with global liquidity, particularly as measured by the M2 money supply. Analysts have described Bitcoin as a “global liquidity barometer,” given how sensitively it responds to central bank monetary policy and systemic liquidity flows. This post examines that relationship over the past 10 years, draws on the work of analysts like Lyn Alden and includes new data and commentary as of April 2025.
We also incorporate charts based on historical Bitcoin price and global M2 data to help visualize the correlation. Our research focuses on global aggregates of M2 across major economies, explores the time lag in Bitcoin's response, and provides a qualitative narrative of the macro drivers.
Part 1: A Decade of Bitcoin and M2
Correlation Overview
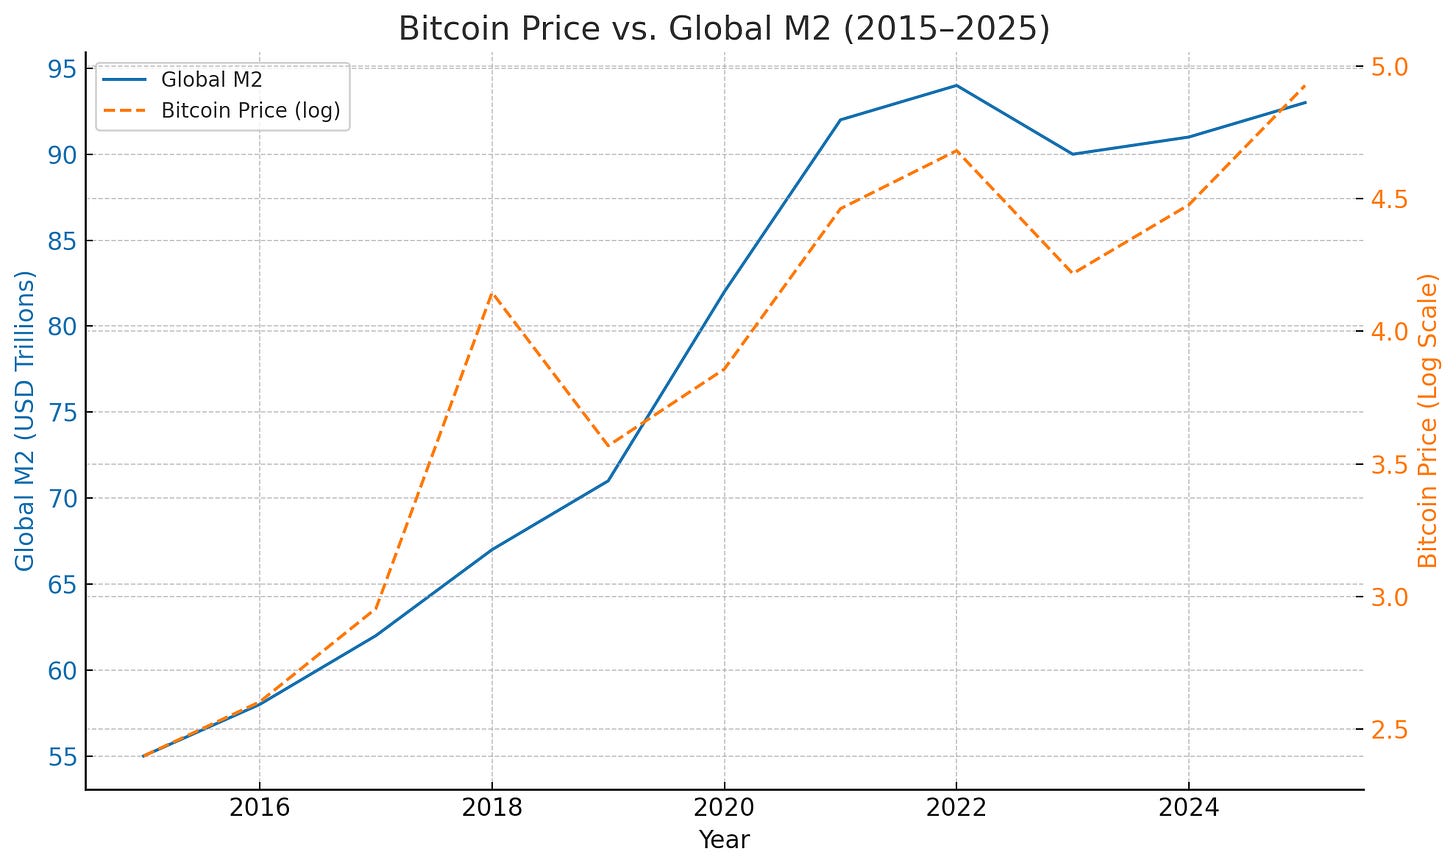
Global M2 money supply—a measure of cash and liquid deposit accounts across major economies—has grown from about $55 trillion in 2015 to more than $95 trillion in 2025. Over the same period, Bitcoin has gone from ~$250 to over $80,000. Empirical analysis shows a high correlation between these two variables:
A 2024 study found a Pearson correlation of 0.94 between Bitcoin's USD price and global M2 over the long term.
Bitcoin price direction matches global M2 direction 83% of the time on a 12-month basis.
Key Patterns
Liquidity expansions (2016–2017, 2020–2021) aligned with major Bitcoin bull markets.
Liquidity contractions (2018, 2022) coincided with sharp corrections in Bitcoin's price.
Expert Perspective
Lyn Alden: "Bitcoin moves in the direction of global liquidity 83% of the time."
Raoul Pal: "Bitcoin = Global M2 x Reflexivity."
Part 2: The Lag Effect
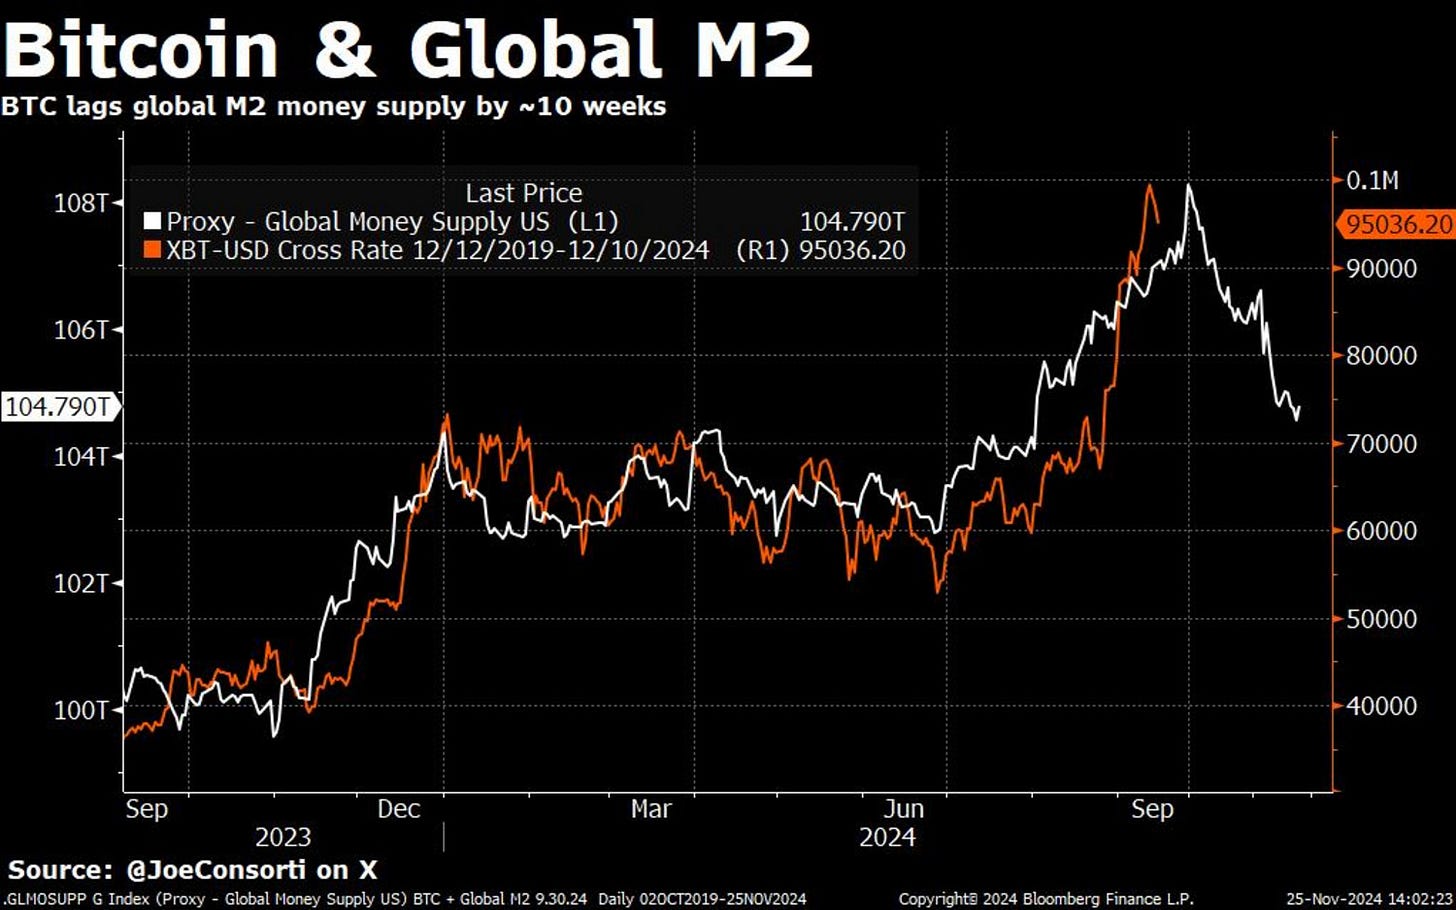
Bitcoin does not react instantly to liquidity changes. Research shows a typical lag of 60 days (2 months):
In 2020, global M2 surged in April and Bitcoin rallied in late June.
In 2022, M2 peaked in Q1 and Bitcoin declined sharply starting in Q2.
In 2023, liquidity started improving mid-year, and Bitcoin bottomed and began a sustained rise 2–3 months later.
Analysts like Matt Crosby and Joe Consorti from Bitcoin Magazine Pro support the 56–70 day range as a consistent lag.
Part 3: Historical Liquidity Cycles and Bitcoin
2015–2017:
Post-2015 Chinese devaluation + ECB & BoJ QE
Bitcoin rose from ~$250 to ~$20,000 by Dec 2017
2018:
Fed QT + China deleveraging
Bitcoin fell from ~$20k to ~$3k
2019:
Fed paused QT, ECB restarted easing
Bitcoin recovered to ~$12k by mid-year
2020–2021:
Global M2 soared post-COVID
Bitcoin exploded from ~$7k to ~$60k+
2022:
Fed hikes + global QT
Bitcoin plunged from ~$47k to ~$16k
2023–2024:
Treasury TGA drawdown, BoJ easing, PBoC credit injection
Bitcoin rebounded to ~$30k, then surged further
Part 4: April 2025 Update
As of April 2025:
Global M2 stands at approximately $92.65 trillion (StreetStats)
This marks a resumption of modest liquidity growth after stagnation in 2022
Bitcoin trades near $84,582, slightly off its January ATH of ~$109,000
This reinforces the lag dynamic: liquidity began improving in Q3 2023, and Bitcoin has followed with a significant price rise over the past 6–9 months.
Matt Crosby notes that Bitcoin continues to respond to changes in global M2 with a lag of about 60 days, maintaining a consistent correlation above 80%.
Chart: Bitcoin price (orange, log scale) vs. global M2 (blue), 2015–2025
Conclusion
The evidence is overwhelming: Bitcoin thrives on global liquidity expansions and withers during contractions. Across the past decade, its strongest rallies have aligned with massive M2 growth, and its worst crashes with tightening cycles.
As of April 2025, global liquidity is once again expanding, albeit cautiously. If past patterns hold, Bitcoin may continue its current uptrend with renewed strength in the months ahead. For long-term investors and macro-watchers, tracking M2 growth remains one of the most valuable indicators of where Bitcoin might go next.
"Fundamentals are no longer the primary drivers of asset prices… liquidity is." – Stanley Druckenmiller
Not financial or legal advice, for entertainment only, do your own homework. I hope you find this post useful as you chart your personal financial course and Build a Bitcoin Fortress in 2025.
Thanks for following my work. Always remember: freedom, health and positivity!
Please also check out my Bitcoin Fortress Podcast on all your favorite streaming platforms. I do a weekly Top Bitcoin News update every week on Sunday, focused on current items of interest to the Bitcoin community. Please check it out if you haven’t already. Also now on Fountain, where you can earn Bitcoin just for listening to your favorite podcasts.
Follow me on Nostr:
npub122fpu8lwu2eu2zfmrymcfed9tfgeray5quj78jm6zavj78phnqdsu3v4h5
If you’re looking for more great Bitcoin signal, check out friend of the show Pleb Underground here.


Life Is veriste